|
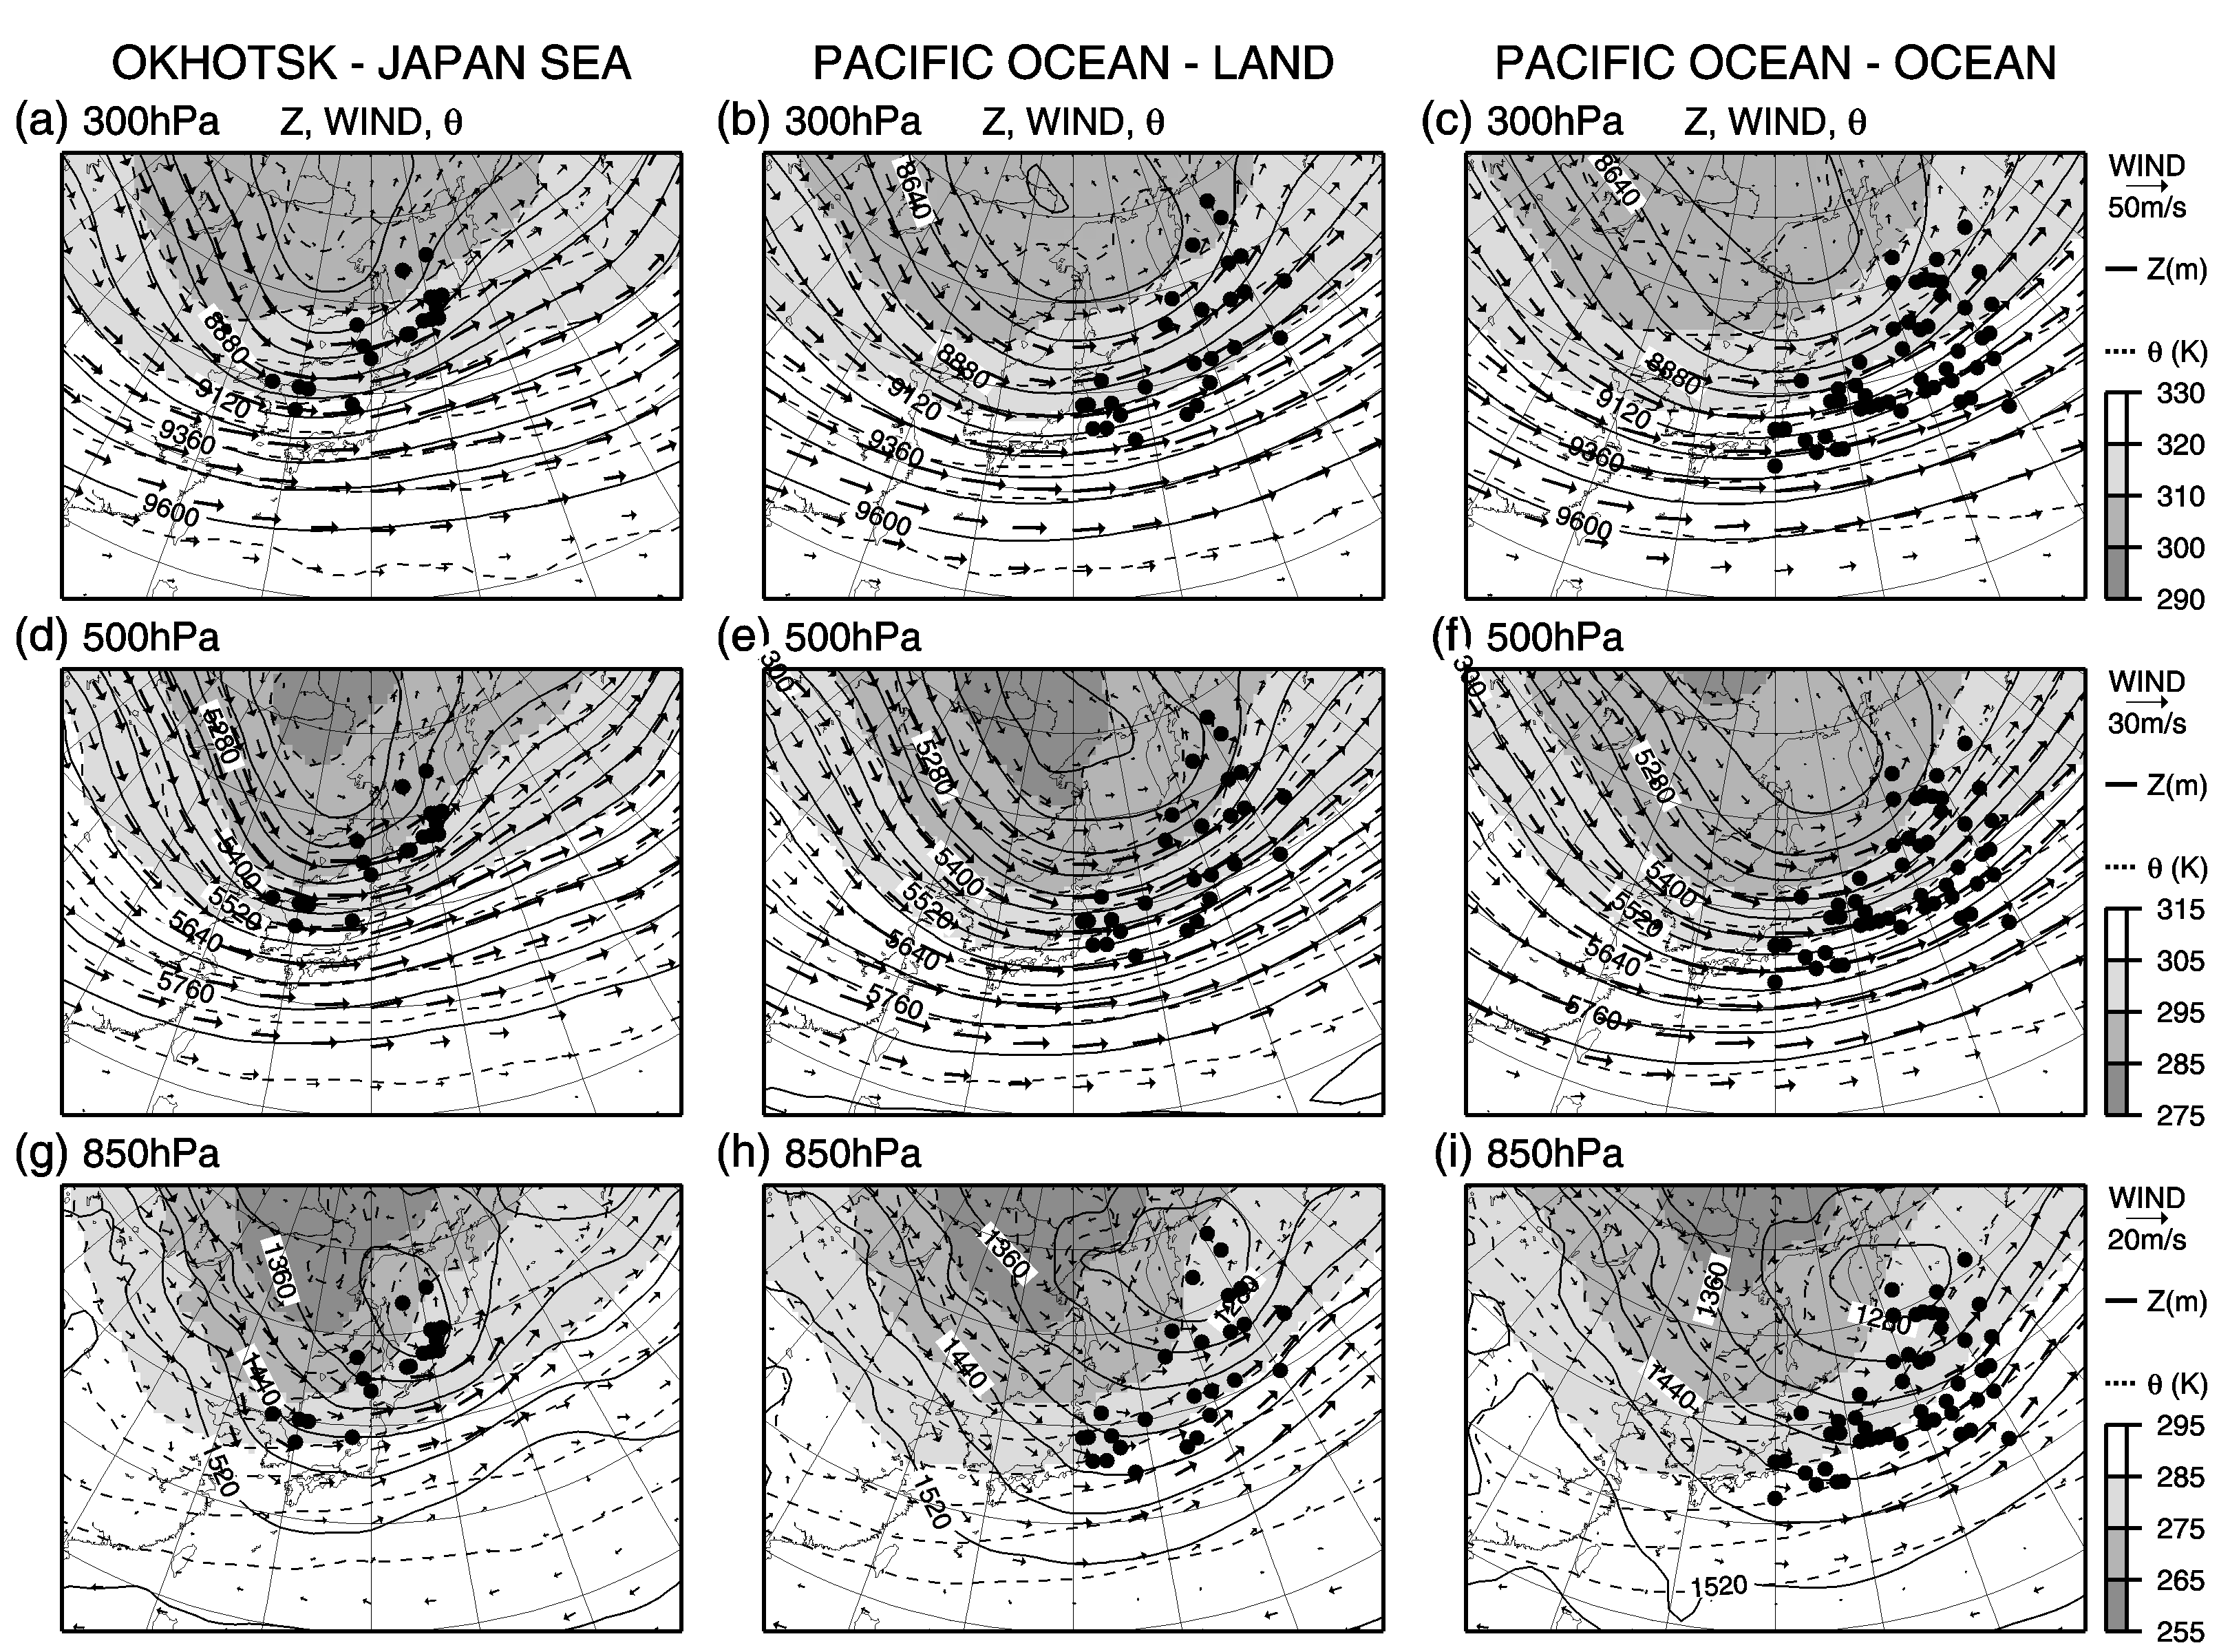
| Figure 2. Composite charts at 300 hPa ((a) - (c)), 500 hPa ((d) - (f)), and 850 hPa ((g) - (i)) for the OJ (left column), PO-L (center column), and PO-O (right column) cyclones at the maximum deepening rate. Solid lines show the geopotential height contours (unit of m, contour intervals are 120 m at 300 hPa, 60 m at 500 hPa, and 40 m at 850 hPa). Arrows show horizontal winds and shade and broken contour show potential temperature (unit of K). Black circles show cyclone centers. |